// Reporting
Evaluations
through bookingtime
Would you like to know which services are booked most frequently? Which times are most popular? Or would you like to decide between different booking pages?
In addition to evaluations of conversion rates, we offer A/B testing to support you in these matters. For example, you can find out which design or wording is more popular with your customers.
// Your online appointment with just a few clicks.
Try it out and save time!
Prepared data & analyses
in your personal Reporting
A/B tests
We analyze for you which booking process or design works best for your market. By that, we create the best possible booking experience for your customers with the highest possible output for you.
CSV Export
Conveniently export your statistics as .csv files at any time. This allows you to import data from bookingtime into other systems for further use.
Reporting interface
You can use our API to automatically retrieve statistical data at any time and process it in your systems. Alternatively, we can also send the data automatically to your interfaces and adapt the process to your needs.
User Journey
With the assistance of user journeys, we can capture the needs of your target groups and present them in a comprehensible, way in order to optimize the booking process for your customers. Even complex processes can be visualized in this way.
Cross-time zone evaluations
We take time zones into account in our statistical analyses so that data can be analyzed individually. Thanks to dashboards, .csv export and interfaces, this data is available to you at any time.
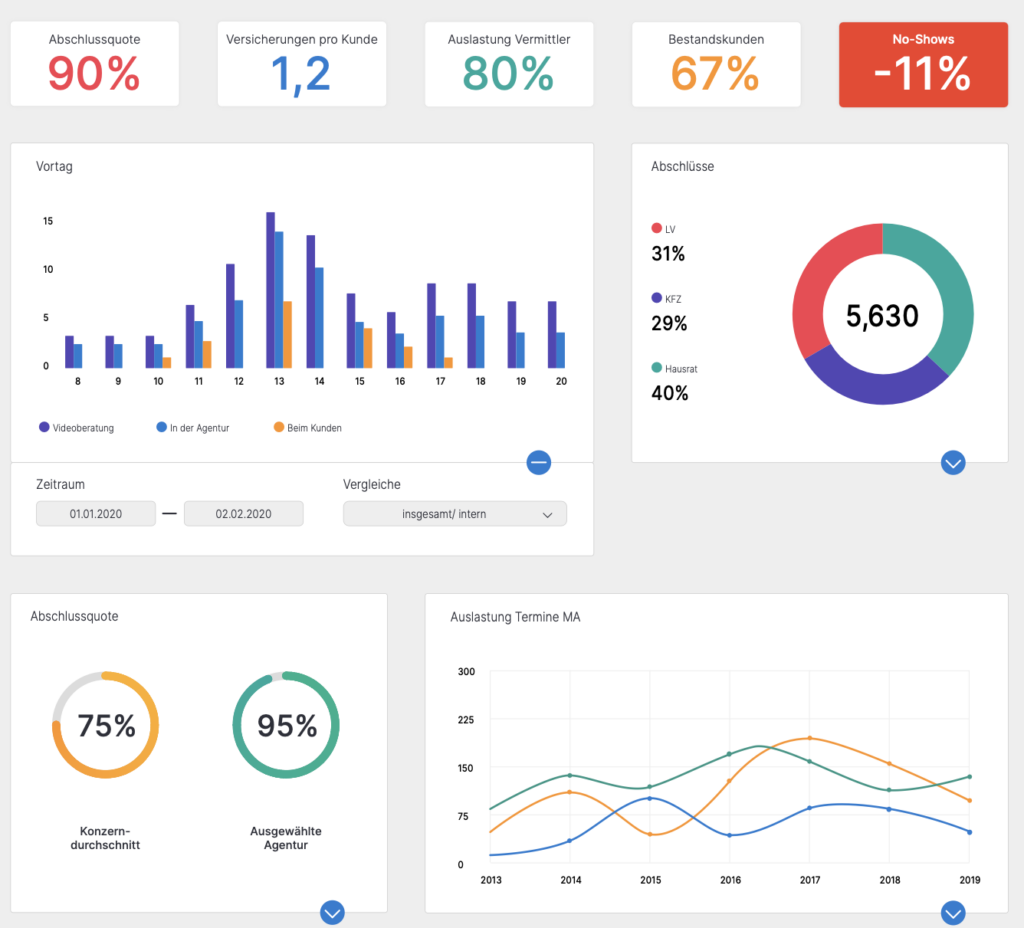
Dashboard
We offer various dashboards on which we display the information that is important to you. For example, you can see at any time, in real time, how often which service is booked by your customers. We will be happy to coordinate the form of presentation with you.


